Fitness and sports buyers don't buy on vibes — they buy on specs. Weight capacity, resistance levels, material grade, dimensions, load rating, grip, durability under stress. A resistance band that holds 150 lbs and one that snaps at 80 lbs look identical in a photo. The difference is performance, and performance has to be proven in the images, because the buyer can't test your gear through the screen.
"Communicate product value without words — through infographics and comparisons."
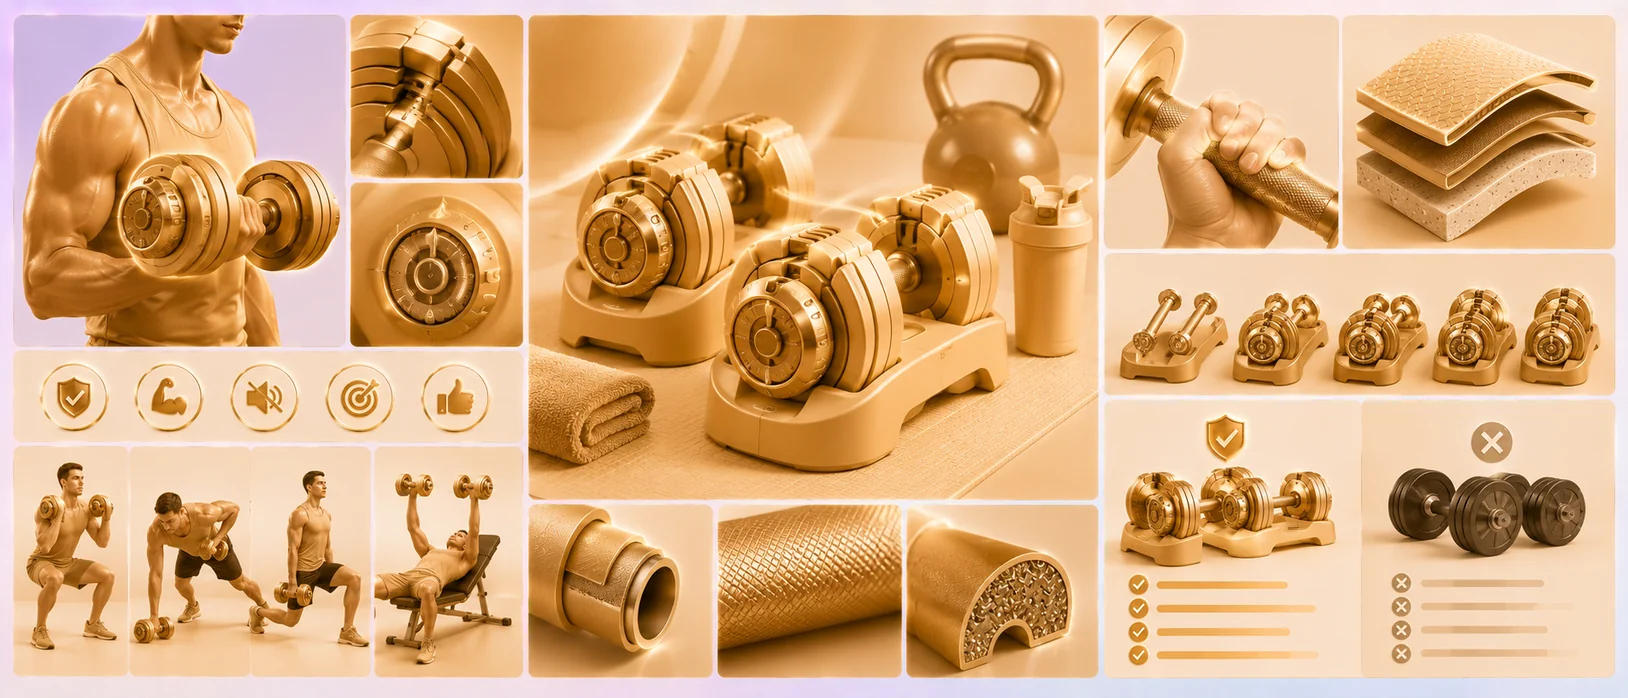
The core job in this categoryFitness & sports is the most infographic-dependent category on Amazon: the products are spec-heavy, the buyers are spec-driven, and the listing that proves performance fastest wins the CVR. Here's how to build infographics that convert in a category where claims mean nothing and proof means everything.
Why Fitness & Sports Is an Infographic Category
Most categories convert on lifestyle and emotion. Fitness & sports converts on proof of performance, and here's why:
- The buyer is evaluating capability. Will this hold my weight? Survive my workouts? Deliver the resistance I need? These are spec questions, and a pretty product photo answers none of them.
- Specs are invisible in a standard photo. A 1000-lb-capacity pull-up bar and a 200-lb one look the same. Your build quality, your materials, your load rating — none of it shows unless an infographic makes it show.
- The buyer is comparing on numbers. Fitness buyers research. They compare weight capacities, resistance ranges, dimensions across listings. The listing that presents those numbers clearly wins the comparison; the one that hides them loses it.
The strategic point: in fitness & sports, an infographic isn't decoration — it's the evidence that converts a skeptical, spec-driven buyer. Every objection in this category is a number or a durability question, and infographics are how you answer them without a word of copy the buyer won't read.
The CVR Problem: "Traffic Comes In, Sales Don't"
"Traffic comes in, sales don't."
In fitness, almost always unproven performanceIn fitness & sports, this almost always means the listing isn't proving performance. The buyer clicked — they're interested — but your images don't answer their spec questions, so they bounce to a competitor who does. You're paying for traffic that leaves because the listing didn't close the capability question.
The fix is specific: convert your image set from "here's the product" to "here's the proof." Every doubt a fitness buyer has — strength, durability, fit, capacity, ease of use — becomes an infographic that resolves it visually. That's the difference between a fitness listing that displays and one that sells.
The Infographic Stack That Proves Performance
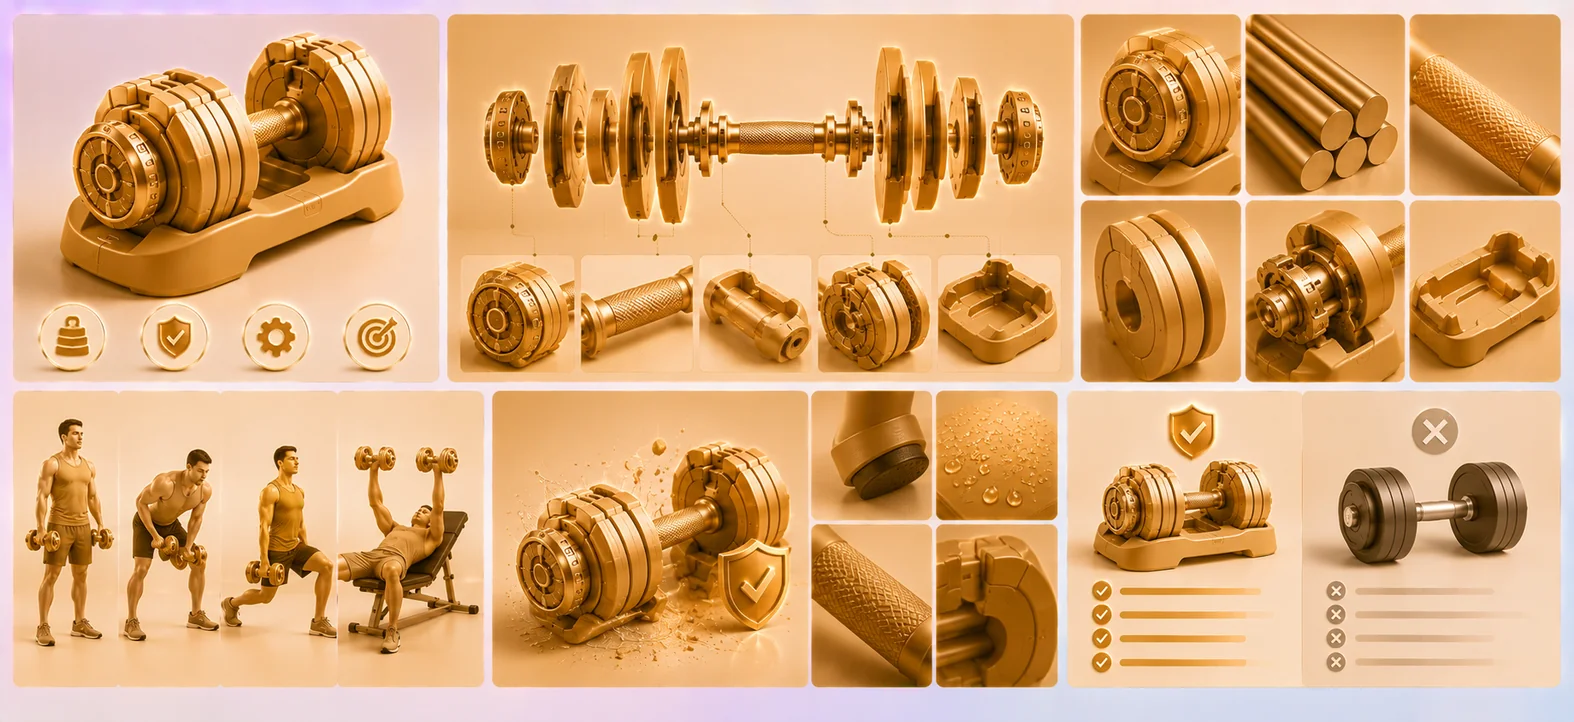
Each image kills a spec objection. Build this:
TOS-compliant (pure white, 85%+ fill, no text/badges), mobile-readable. In fitness & sports, the main should telegraph quality and scale through the product itself — a buyer should sense "sturdy, serious, capable" at thumbnail size. This earns the click against the category wall.
Lead with the single number that matters most: weight capacity, resistance range, load rating. "Holds 1000 lbs." "Resistance: 10–150 lbs." The spec that defines the purchase, shown big and clear. This is the infographic that converts the spec-driven buyer fastest.
The full spec set the buyer is comparing: dimensions, weight, capacity, materials, adjustability. Shown against scale references where size matters. Fitness buyers cross-shop on these numbers — present them clearly and you win the comparison.
"Will it survive my workouts?" Show the material grade, the stitching, the welds, the reinforcement, the stress points. Prove the gear won't fail under load. This is the durability infographic that closes the buyer who's been burned by gear that broke.
Show the product being used correctly — proper form, real exercise, correct body position. This proves the gear works as intended and helps the buyer picture their own use. Allowed on 2–7, and in fitness it doubles as instruction.
A comparison infographic (no named competitors — TOS): your capacity, materials, resistance range, or durability vs the value tier. Fitness buyers comparison-shop on specs — do the comparison for them and justify your price.
Warranty, guarantee, certifications, an established-brand cue. Close the buyer who needs assurance the gear (and the brand) will hold up.
Every infographic is evidence. In a category where the buyer is asking "can this perform," the listing that proves it fastest — number by number, stress point by stress point — wins the CVR and the ACOS math that follows.
A+ Content: Where Spec-Heavy Listings Cement the Sale
If you have Brand Registry, A+ is built for spec-heavy categories — it lifts CVR 8–15% and gives you room to prove performance in depth:
- Spec comparison chart — your full spec set vs the value tier. Fitness buyers convert on spec tables.
- Durability/material modules — the build proof, expanded.
- Use/form modules — exercises, routines, correct usage.
- Trust module — warranty, certifications, brand credibility.
In fitness & sports, A+ is where the comparison-shopping buyer does their final due diligence. A spec-rich, proof-heavy A+ closes the sale that the carousel started.
The Case: What Proof-Driven Infographics Move
We've shipped listings in Sports, and the pattern is consistent. Take a representative example — a fitness SKU (say, a resistance/strength product) doing 20,000 sessions/month at $34 AOV, stuck at 8% CVR, ACOS climbing past 38% because the listing showed the product but never proved the performance.
The audit found the classic fitness failure: a nice product photo, vague "premium quality" icons, no hero spec, no durability proof, no spec comparison. The buyer's spec questions — capacity, resistance, durability — went unanswered, so they bounced to a competitor whose infographics answered them.
The refresh: a hero-spec image (the capacity number, big), a visualized full-spec image, a durability/build-proof image, an in-use form image, and a spec comparison vs the generic. Result pattern in this category: CVR moving from ~8% toward 12–14%, which on 20k sessions at $34 AOV is +$27k–$41k/month on the same traffic — plus the ACOS relief from a listing that finally converts the spec-driven clicks it was buying.
"Need to lift CVR."
In fitness, you lift CVR by proving performanceIn fitness & sports, you lift CVR by proving performance. The traffic is there; the leak is unanswered spec questions. Plug them with infographics and the numbers move.
The ACOS Connection
The math is the same as every category, and it routes through CVR:
- Better infographics → spec questions answered → higher CVR → lower cost per acquisition → lower ACOS.
- Lower ACOS → room to bid profitably → more converting sessions → stronger velocity → higher BSR.
- Higher rank → more free traffic → less PPC dependence.
"Burning PPC, ACOS is climbing."
You can't out-bid an unanswered objectionIn fitness & sports, climbing ACOS usually means you're paying to send spec-driven buyers to a listing that doesn't prove specs. You can't out-bid an unanswered objection — the buyer bounces no matter how much you paid for the click. Infographics that prove performance are the lever that converts that paid traffic instead of wasting it.
This is loss aversion in plain numbers: every spec-driven buyer who bounces because your listing didn't prove capability is a booked loss on traffic you already paid for.
Why Generic Design Fails Fitness Listings
"Hired someone on Fiverr for $80. The images looked nice but my conversion actually dropped."
Amazon seller forumIn fitness & sports, the Fiverr trap is decorative infographics — three icons that say "Durable / Premium / Quality" with no numbers, no proof, no spec evidence. They look fine and convert nothing, because the spec-driven buyer needs data, not adjectives. A generalist doesn't know that fitness converts on proven performance, doesn't structure infographics around the specific spec objections in your category, and may bury the one number that matters most.
We're more expensive than Fiverr. In a spec-heavy category, the comparison isn't $80 vs a package — it's $80 vs the CVR you leave on the table when your infographics decorate instead of prove. A fitness listing built to prove performance — hero spec, full specs visualized, durability shown, comparison made — pays back in days through lifted CVR and lower ACOS, and compounds through rank. Decorative design keeps your specs invisible, which keeps your CVR low.
FAQ
- What makes a fitness or sports product listing convert on Amazon?
- Proof of performance, shown through infographics. Fitness & sports buyers are spec-driven — they need to see weight capacity, resistance range, dimensions, materials, and durability proven visually, because they can't test the gear through the screen. A hero-spec image, visualized full specs, durability proof, in-use demonstration, and a spec comparison answer the capability questions that decide the sale.
- Why are infographics so important for fitness products?
- Because specs are invisible in a standard product photo — a 1000-lb-capacity bar and a 200-lb one look identical. Fitness buyers compare on numbers (capacity, resistance, dimensions, durability), so infographics are the evidence that proves performance and wins the comparison. In this category, infographics aren't decoration; they're the conversion mechanism.
- What should the first infographic on a fitness listing show?
- The single most important performance number — weight capacity, resistance range, or load rating — shown big and clear. This "hero spec" image converts the spec-driven buyer fastest because it answers the defining purchase question (can this perform?) before they have to dig for it.
- Why is my fitness listing getting traffic but not converting?
- Almost always because the images show the product but don't prove the performance. Spec-driven buyers click, find their capacity/durability/resistance questions unanswered, and bounce to a competitor whose infographics answer them. The traffic is there; the leak is unproven specs — fixable by converting the image set from "here's the product" to "here's the proof."
- Do decorative "Durable / Premium / Quality" infographics work for fitness?
- No. Adjective-icon infographics with no numbers convert poorly in fitness & sports because the buyer needs data, not descriptors. "Holds 1000 lbs" converts; "Premium Quality" doesn't. Effective fitness infographics are built around specific spec objections with real numbers, durability proof, and comparisons — not generic quality claims.
Win the click before you prove the specs. First image free.
In a category where buyers buy on proven specs, your main image wins the click and your infographics prove the performance — and the main is the cheapest asset to test first. Send your ASIN — we'll rebuild your main image at no cost: quality-signaling, mobile-first, TOS-compliant, built to win the click against your niche leader. If it doesn't beat your current image in a PickFu A/B, you owe nothing — and you'll see how the same proof-driven approach carries through your full spec infographics.
Claim my free image →